Initial State
This blog is meant to talk about the analytics service provided by Initial State. There are two different licenses that can be purchased: the standard and the professional. This analytics tool is meant to stream data onto the Initial State dashboard in order to monitor devices and events from a browser. This service can work with anything that can make an HTTP request or that can output data to be streamed online.
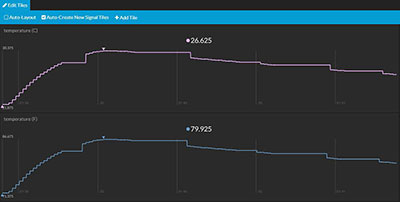
This is a great tool for anything that the user would like to remotely monitor. It helps to show trends in activity, peak events, triggered events, and more. The service takes the data that is being streamed in and graphically represents the information in the manner of the user’s choosing. While working through this project, I was able to stream data from a thermal probe and open and close a door with a reed switch and magnet actuator. The example on the right shows the data from the temperature probe using Fahrenheit and Celsius scales when I held it to warm it up, then put it back to let it cool back down:
If there is a situation that needs to be monitored in a system that outputs data, this service is definitely worth looking at. More information about this product can be found on EEWiki, and feel free to ask any questions in the TechForum.

Have questions or comments? Continue the conversation on TechForum, DigiKey's online community and technical resource.
Visit TechForum


